My analysis is all about capturing the unique identity of each player while staying true to the realism of their playstyles and performances. Perfect ratings and attributes are difficult to master, but the closer we get, the better the experience is for everyone. Players should feel like characters/superheroes like for other video games — they should play exactly as you’d expect or close to. If you try to use them outside of their natural roles and skill sets, there should be clear consequences (unless developed over time in modes like Career).
For example, a developing playmaker from the (NRL) Roosters or a veteran playmaker from (EL1) Barrow should still have superior kicking abilities compared to a prop like Payne Haas (Broncos). Similarly, outside backs — regardless of the league — should naturally be quicker than most forwards, aside from rare exceptions. This is a big challenge, but one with massive upside.
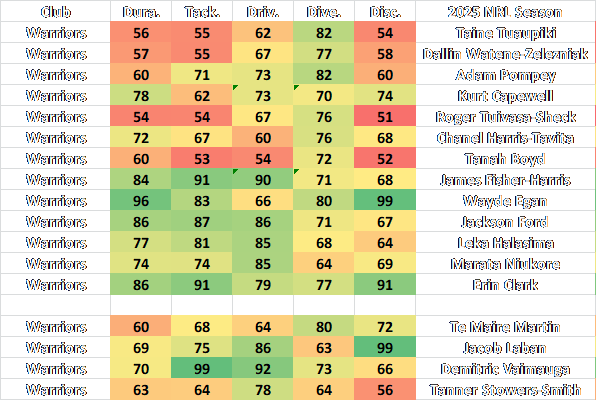
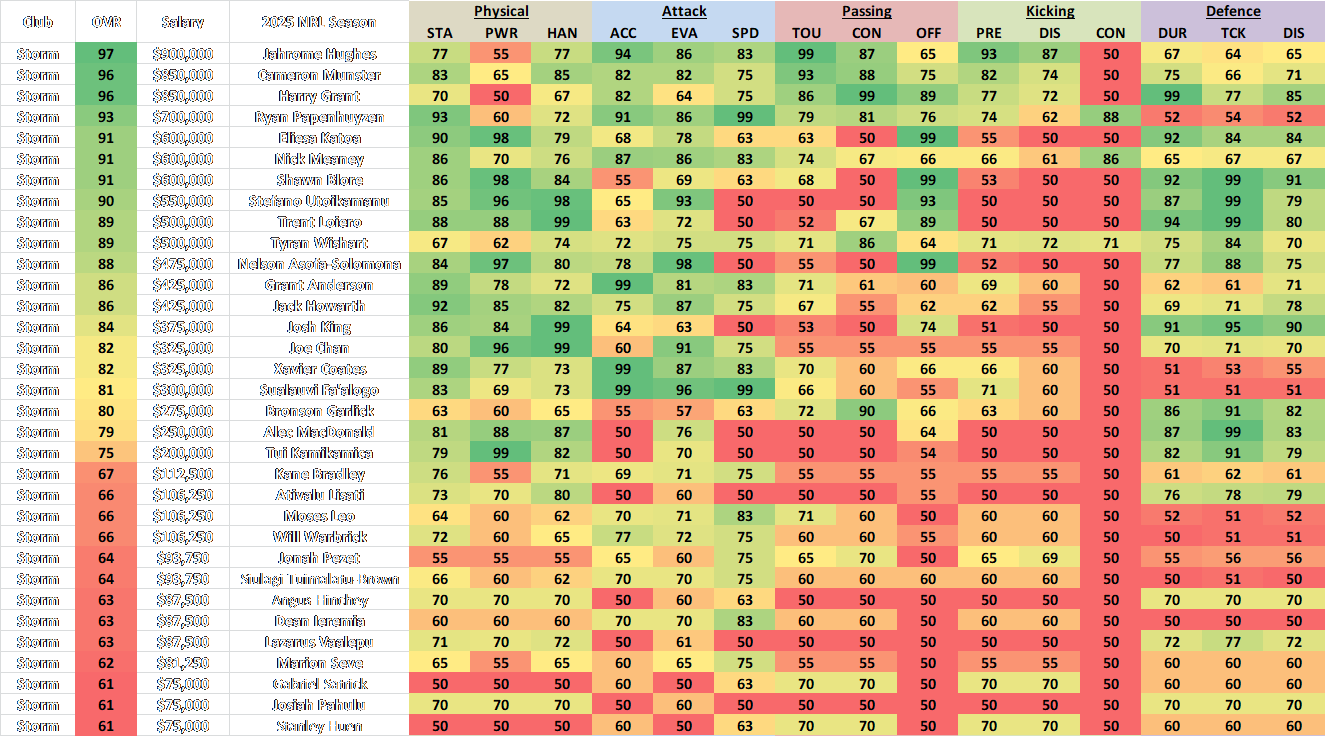
Stamina should be measured separately for on-ball (in attack) and off-ball (in defence) efforts. The Fitness/Durability Attribute could be split into Attacking Work Rate and Defensive Work Rate to reflect this. Tackling skill reflects how effective and reliable a player is when making tackles, while driving and diving tackle skills could be influenced by a player’s physical characteristics (such as strength and agility). The Discipline trait affects things like rushing out of the line, making high contact, and how long a player holds on in the play-the-ball. The higher a player’s Discipline rating, the more they can push the boundaries without being penalised.
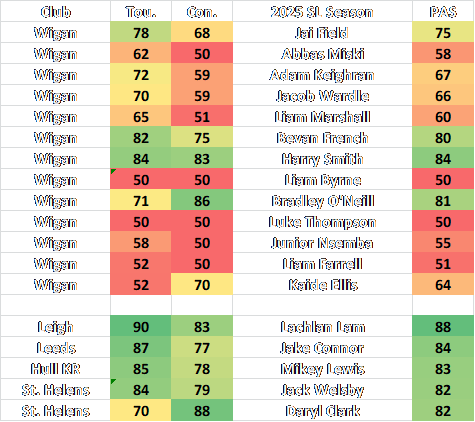
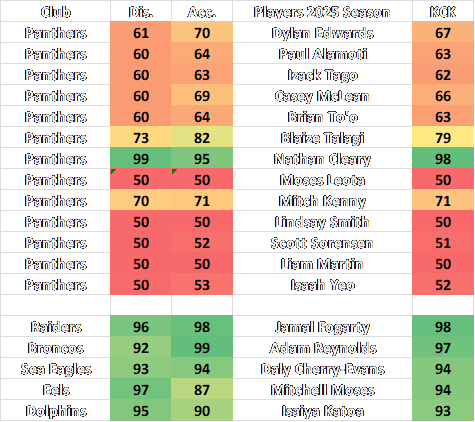
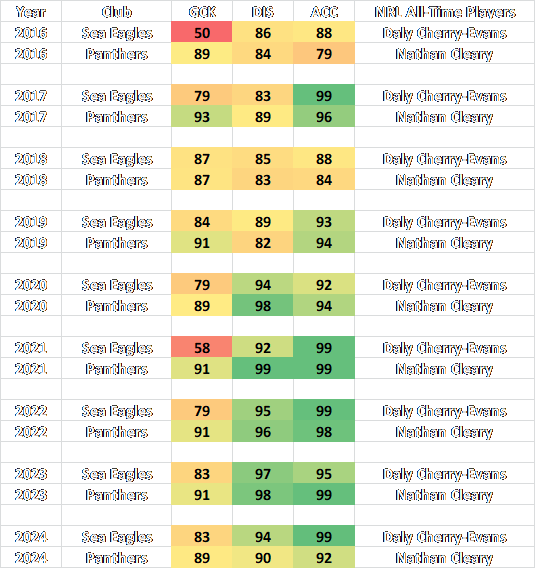
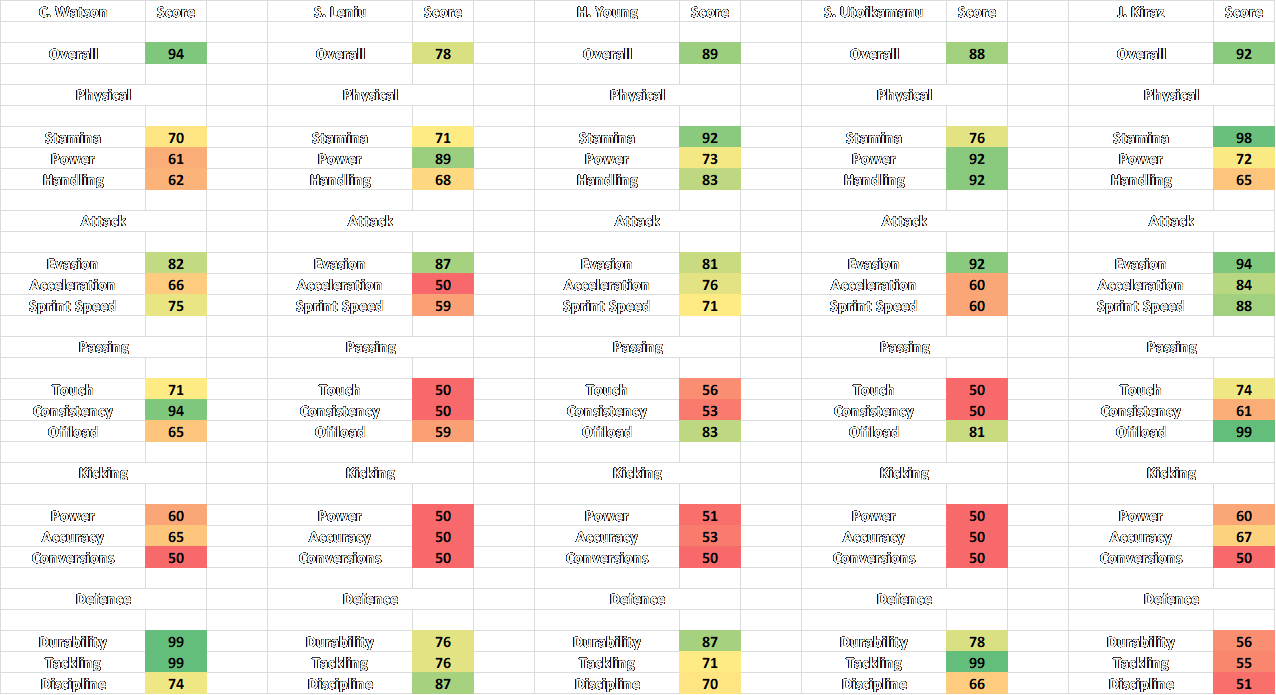
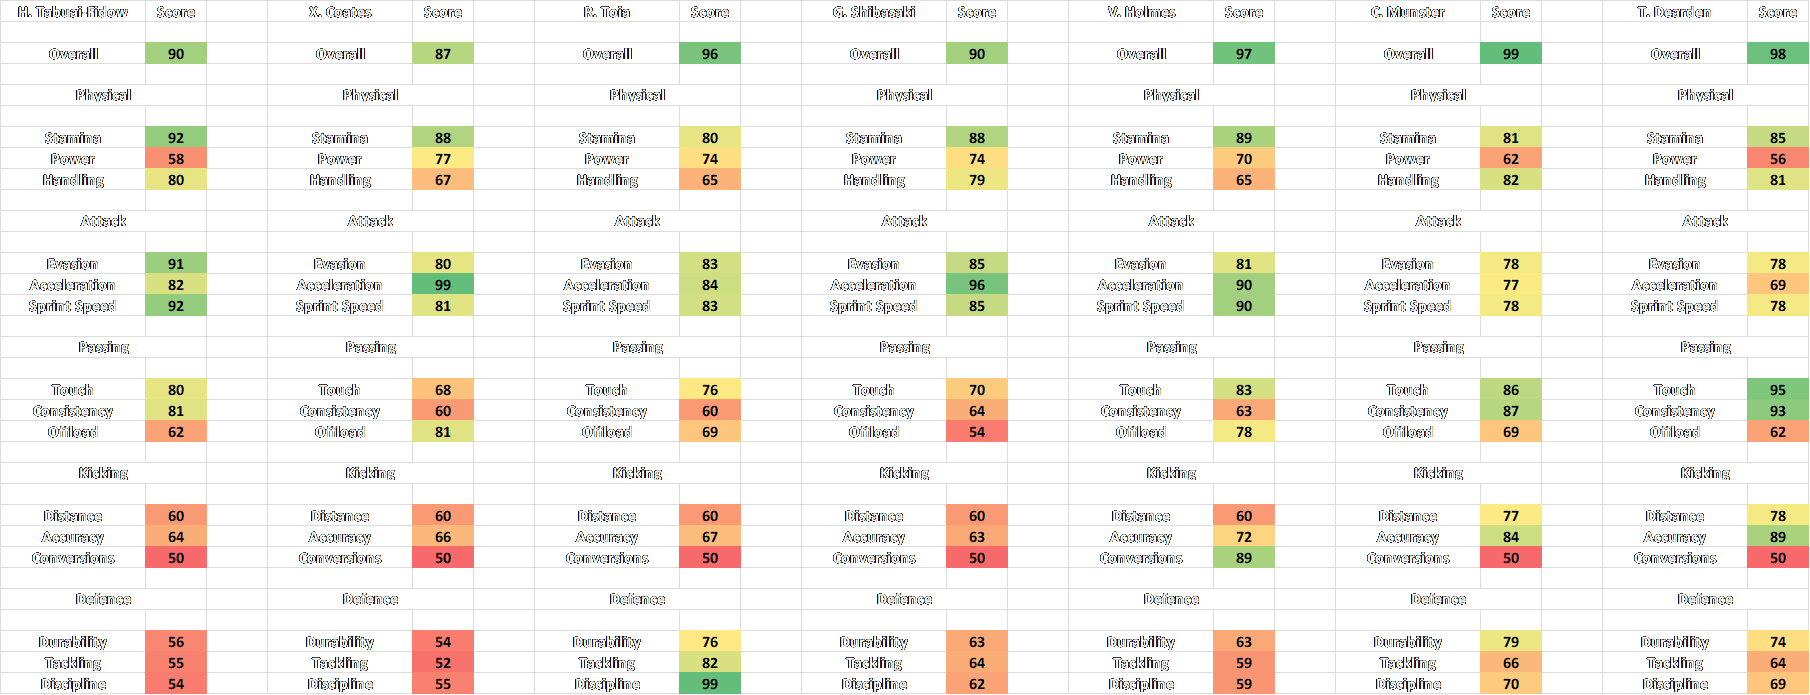
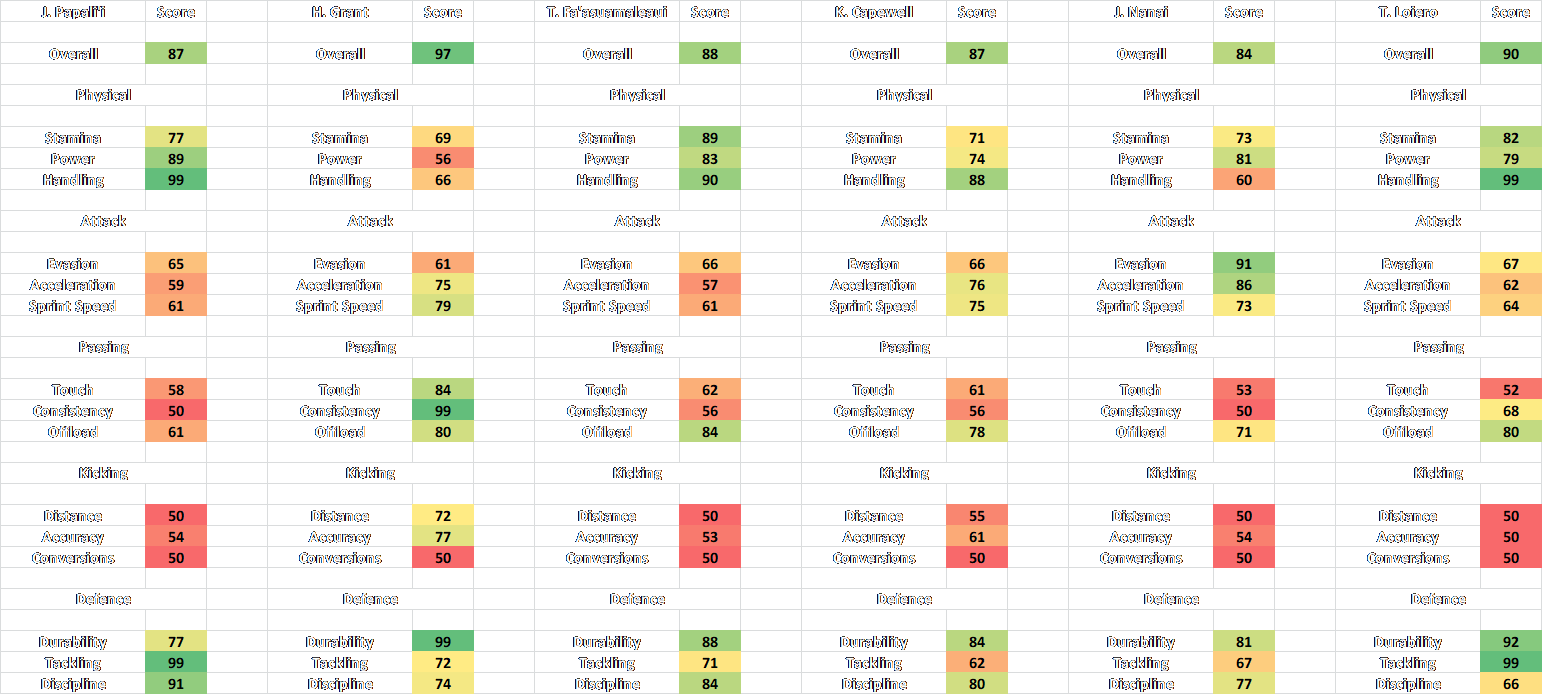
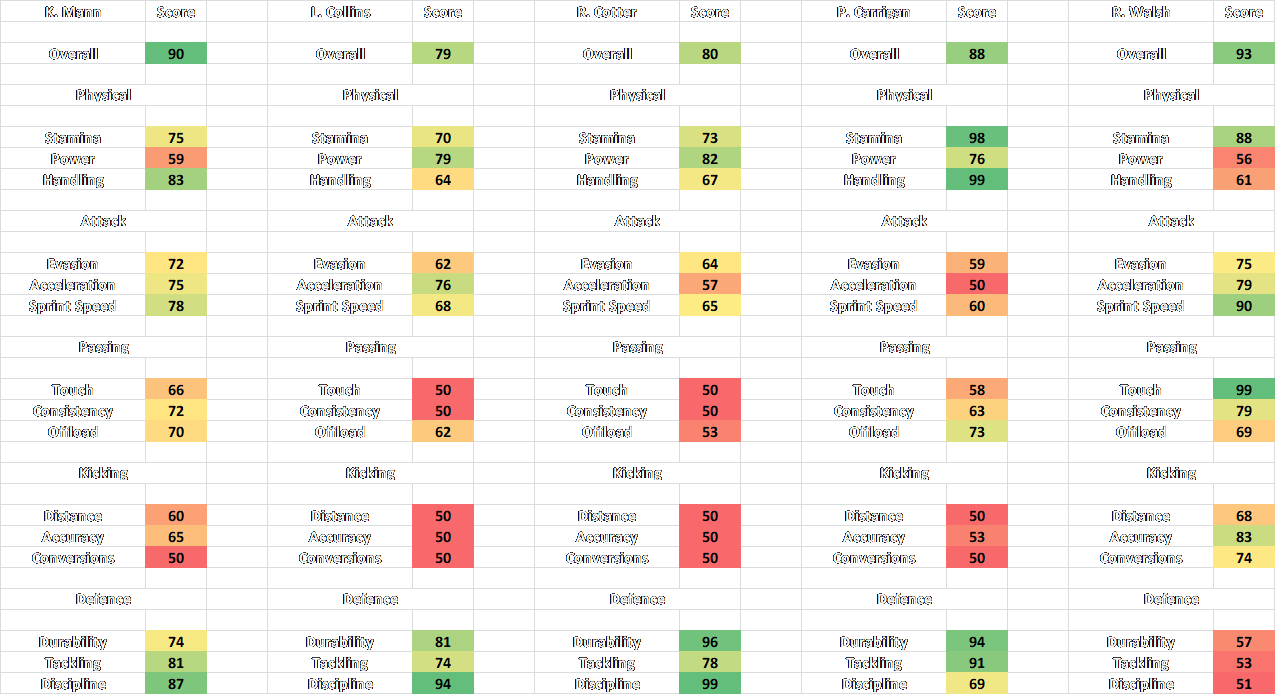
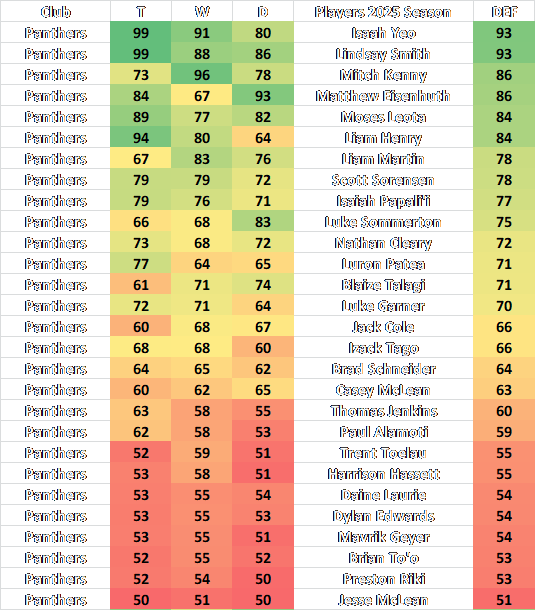
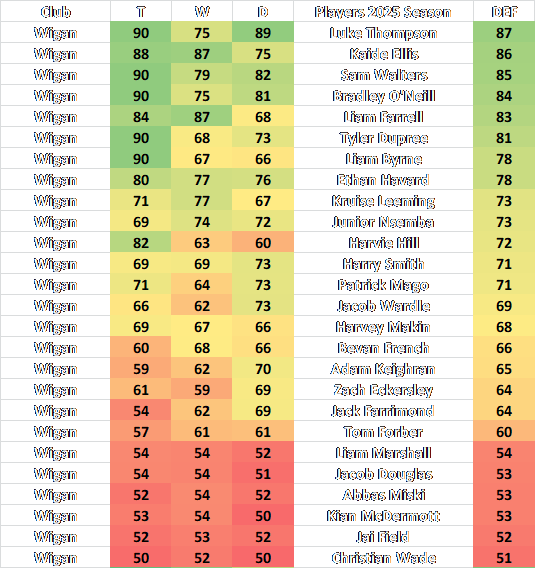
**Below are defensive skill ratings that highlight the defensive playstyles of players from the Penrith Panthers (NRL) and Wigan Warriors (Super League). This comparison helps showcase the differences between the leagues, providing both realism through data-driven stats and balance between the strength of each competition. The data reflects performances up to this point in the 2025 season.
T = Tackling
W = Work Rate (Defence)
D = Discipline
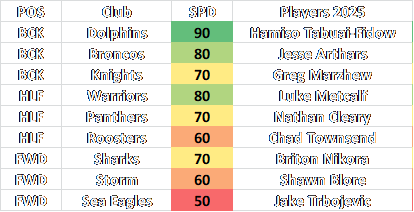
A player’s pace rating (specifically sprint speed) differs from most other skills, which can typically be measured through multiple data points. Pace, in many cases, is more of an eye-test observation. As mentioned earlier, there should be a noticeable difference between the fastest backs and the slowest forwards in the game.
For example, in a rating system ranging from 50 to 90, we could categorize players as follows:
Backs (Fullback, Winger, Centre): 70–90 range
Halves (Halfback, Five-eighth, Hooker): 60–80 range
Forwards (Prop, Second Rower, Lock): 50–70 range
Players in utility roles would have their limits adjusted accordingly. Take Luke Garner (Panthers)—having started 4 games at both centre and second row (excluding bench starts), his sprint speed rating ceiling would sit around 80, with a lower limit of 60, reflecting his versatility across positions.
Below is a view of how it could possibly look, with player examples. In each category a player above average, average and below average sprint speed.
Please anyone feel free to share your thoughts on player ratings (overalls, attributes, skills, traits, characteristics) and how we can help make it more realistic and unique to each player.
Let’s ‘Make League Great Again’. #MLGA #RL26 Rugby League 26 @RossSymons @bradthelad